What £39,200 Median Household Income Really Measures
Median UK household disposable income reached £39,200 in the financial year ending 2025, up 3.5%, with both the poorest and richest fifths returning to earlier levels while the gap between them stayed flat. The survey's sample fell 29%, and the ONS attaches specific data-quality warnings to finer breakdowns.
What the figures say
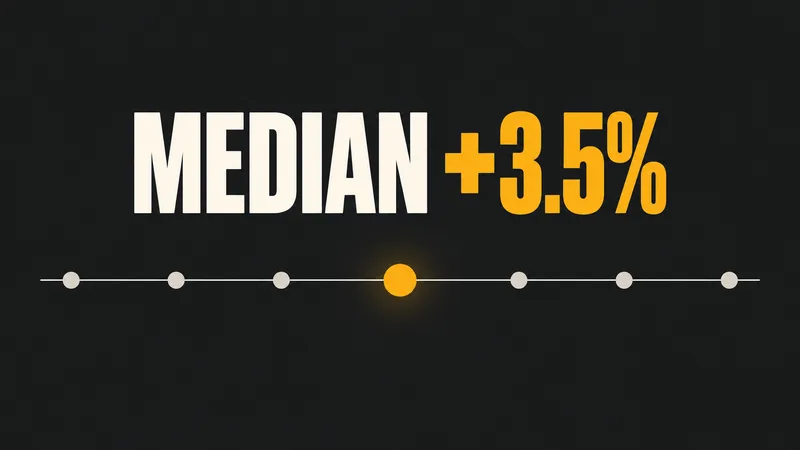
Median household disposable income in the UK was £39,200 in the financial year ending 2025, up 3.5% on the year before. The headline number is straightforward. The sample behind it is not.
The figures come from the ONS Household Finances Survey and were published on 2 October 2026, covering April 2024 to March 2025. They are accredited official statistics, independently reviewed against the Code of Practice for Statistics.
Disposable income here means what households have left after direct taxes such as Income Tax, National Insurance and Council Tax. It includes earnings, private pensions and investments, and state cash benefits, and it is adjusted for household composition so that households of different sizes can be compared.
The distribution, not just the average
The more informative numbers are the ones by income group.
The poorest fifth of households had median disposable income of £18,300, an increase of 5.6% that brings the group back in line with pre-pandemic levels in the financial year ending 2020. The richest fifth reached £77,000, up 5.0%, returning to levels last seen in the financial year ending 2021 after two years of decline.
The gap between them stayed the same. The ratio of mean income for the richest fifth to the poorest fifth remained at 5.6, and the Gini coefficient moved down slightly by 0.2 percentage points to 32.7%. The ONS describes inequality as relatively stable between the two years.
Growth at both ends of the distribution, then, without a large change in the gap between them on these two summary measures.
The warning attached to this year's data
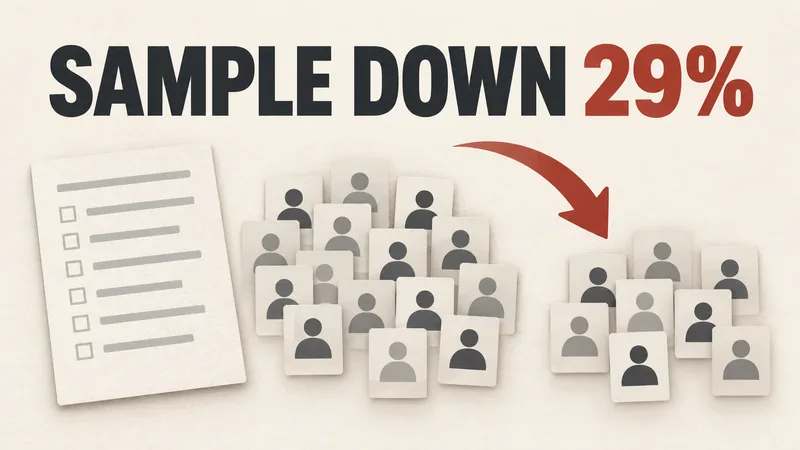
The survey's achieved sample fell by 29%, from 11,300 households to 8,000, after the Survey on Living Conditions was stopped in February 2025. The Living Costs and Food Survey now provides a larger share of the underlying data, rising from 38% to 63%, and from the financial year ending 2026 it will be the only source.
That transition, the smaller sample and increased non-response bias created a compositional shift that current weighting does not fully correct.
The consequences are listed in the bulletin. Decile-level estimates diverge from the Department for Work and Pensions' Households Below Average Income series, which still broadly agrees at headline and quintile level. Estimates for retired households are less coherent with that series and carry particular uncertainty this year. Several detailed tables covering components of original income, cash benefits and direct taxes had values suppressed because household counts were too low.
The retired-household problem is spelled out: the share of retired households in the top quintile rose by 3.7 percentage points even though their share of the weighted sample rose by only 0.8 points, with owner-occupiers up 2.5 points and social renters down 5.6 points. That is a shift toward richer retired homeowners that weighting does not fully absorb.
What changed underneath the numbers
One policy change affects comparisons with earlier years. Cost-of-living payments for low-income benefits and tax credits, disability benefits and pensioners were available in the financial years ending 2023 and 2024 but were discontinued in the year covered here, so households received none in this period.
Anyone comparing year-on-year changes should check which support was in payment.
Who the survey does not cover
The Household Finances Survey samples private households. It excludes people in institutional settings such as care homes and hostels, and people who are homeless, so many of the poorest households are unlikely to be captured.
Income surveys also tend to under-report at both ends of the distribution. An adjustment addresses under-coverage of the richest households from the financial year ending 2002, and the bulletin says measurement issues at the bottom remain.
What to do with these numbers
The bulletin effectively asks for restraint on detail. Headline and quintile movements are presented as broadly consistent with the main poverty series, while decile-level and retired-household movements should be read alongside the published uncertainty measures rather than on their own.
The ONS also sets out what comes next: the Living Costs and Food Survey becomes the sole source from the financial year ending 2026, with its issued sample rising to 30,000 households from April 2026, and the agency plans a further review of weighting methods to reduce the impact of the smaller sample.
Sources & further reading
- Average household income, UK: financial year ending 2025Office for National Statistics · accessed Oct 12, 2026
- Average household income, UK: financial year ending 2025 (release page)Office for National Statistics · accessed Oct 12, 2026